
Straight Line Graphs
Straight line graphs are usually of the form:
| (1) | y = ax + c | |
| c is where the straight line graph crosses the y axis | ||
| (2) | ax + by = c | |
| c/b is where the straight line graph crosses the y axis. For this type of equation begin by making y the subject. This has already been done in: Solving Equations − Add and Subtract and Solving Equations − Multiply and Divide |
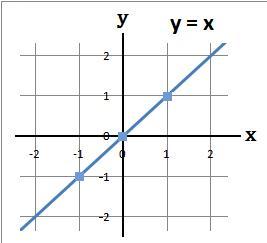
- Example 1. Plot the graph y = x
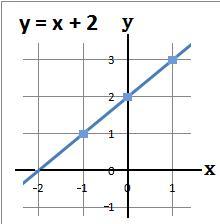
- Example 2. Plot the graph y = x + 2
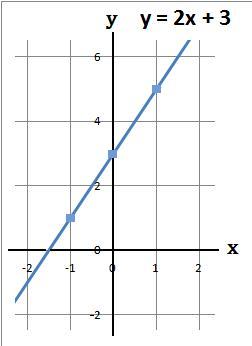
- Example 3. Plot the graph y = 2x + 3
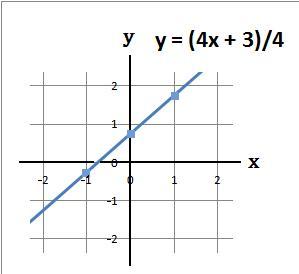
- Example 4. Plot the graph 4y − 4x = 3
(a) Using a table work out the values of y
|
(b) The coordinates of the above are (−1, −1) (0, 0) and (1, 1)
(c) Plot the above coordinates and draw a line through these points
(a) Using a table work out the values of y
|
(b) The coordinates of the above are (−1, 1) (0, 2) and (1, 3)
(c) Plot the above coordinates and draw a line through these points
(a) Using a table work out the values of y
|
(b) The coordinates of the above are (−1, 1) (0, 3) and (1, 5)
(c) Plot the above coordinates and draw a line through these points
(a) Make y the subject
(b) Using a table work out the values of y
y = (4x + 3)/4
|
(c) The coordinates of the above are (−1, −0.25) (0, 0.75) and (1, 1.75)
(d) Plot the above coordinates and draw a line through these points