
Quadratic Graphs using x and y axis − 2
Quadratic graphs of the form ax2 + bx + c can be drawn by working out where the graph crosses the:
- Y axis − at the number term c in the equation ax2 + bx + c
- X axis − by first solving the quadratic so that ax2 + bx + c = 0. Refer to Solve Quadratics by Factorising - 2
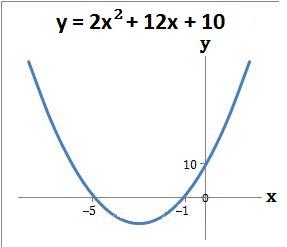
- Example 1. Draw the graph y = 2x2 + 12x + 10
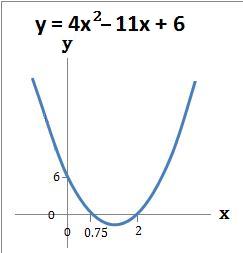
- Example 2. Draw the graph y = 4x2 − 11x + 6
(a) The graph crosses the y axis at the number term c which is 10. When x = 0 then y = 10. The coordinate is (0, 10)
(b) The graph crosses the x axis where 2x2 + 12x + 10 = 0. Refer to example 1 of Solve Quadratics by Factorising - 2. So y = 0 when x = −5 or −1. The coordinates are (−5, 0) and (−1, 0)
(c) Draw the graph using the above coordinates
(a) The graph crosses the y axis at the number term c which is 6. When x = 0 then y = 6. The coordinate is (0, 6)
(b) The graph crosses the x axis where 4x2 − 11x + 6 = 0. Refer to example 2 of Solve Quadratics by Factorising - 2. So y = 0 when x = 0.75 or 2. The coordinates are (0.75, 0) and (2, 0)
(c) Draw the graph using the above coordinates