
Plotting Quadratic Graphs − 2
Quadratic graphs of the form ax2 + bx + c can be drawn by first working out the coordinates.
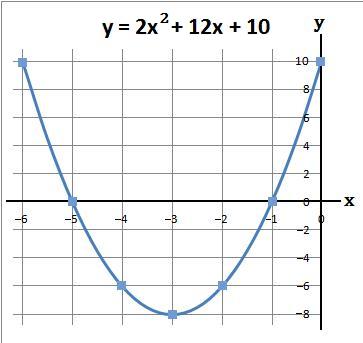
- Example 1. Plot the graph y = 2x2 + 12x + 10 when x is between -6 and 0
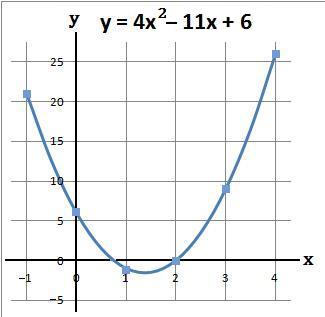
- Example 2. Plot the graph y = 4x2 − 11x + 6 when x is between -1 and 4
(a) Using a table work out the values of y
y = 2x2 + 12x + 10
(b) The coordinates of the above are
(−6, 10), (−5, 0), (−4, −6), (−3, −8), (−2, −6), (−1, 0) and (0, 10)
(c) Plot the above coordinates and draw a line through these points
(a) Using a table work out the values of y
y = 4x2 − 11x + 6
(b) The coordinates of the above are
(−1, 21), (0, 6), (1, −1), (2, 0), (3, 9) and (4, 26)
(c) Plot the above coordinates and draw a line through these points