Plotting Quadratic Graphs − 1
Quadratic graphs of the form x2 + bx + c can be drawn by first working out the coordinates.
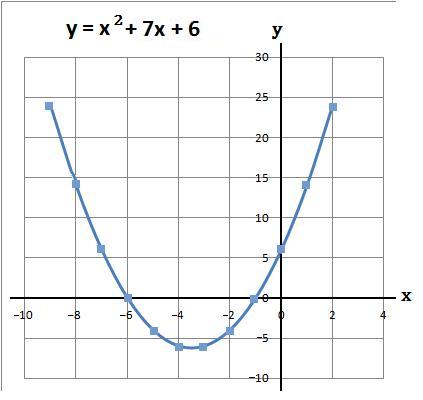
- Example 1. Plot the graph y = x2 + 7x + 6 when x is between −9 and 2
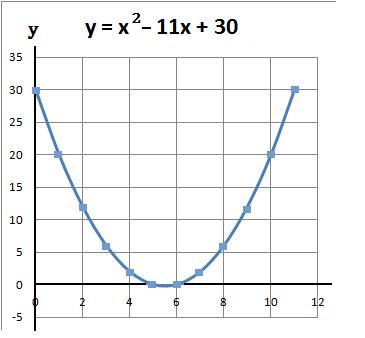
- Example 2. Plot the graph y = x2 − 11x + 30 when x is between 0 and 11
(a) Using a table work out the values of y
y = x2 + 7x + 6
(b) The coordinates of the above are
(−9, 24), (−8, 14), (−7, 6), (−6, 0), (−5, −4), (−4, −6), (−3, −6), (−2, −4), (−1, 0), (0, 6), (1, 14) and (2, 24)
(c) Plot the above coordinates and draw a line through these points

(a) Using a table work out the values of y
y = x2 − 11x + 30
(b) The coordinates of the above are
(0, 30), (1, 20), (2, 12), (3, 6), (4, 2), (5, 0), (6, 0), (7, 2), (8, 6), (9, 12), (10, 20) and (11, 30)
(c) Plot the above coordinates and draw a line through these points


